- PRISMA flowchart
- 4 min read
- By George Burchell
- View publications on PubMed
- ORCID
From deduplication counts to a PRISMA flowchart: a worked example
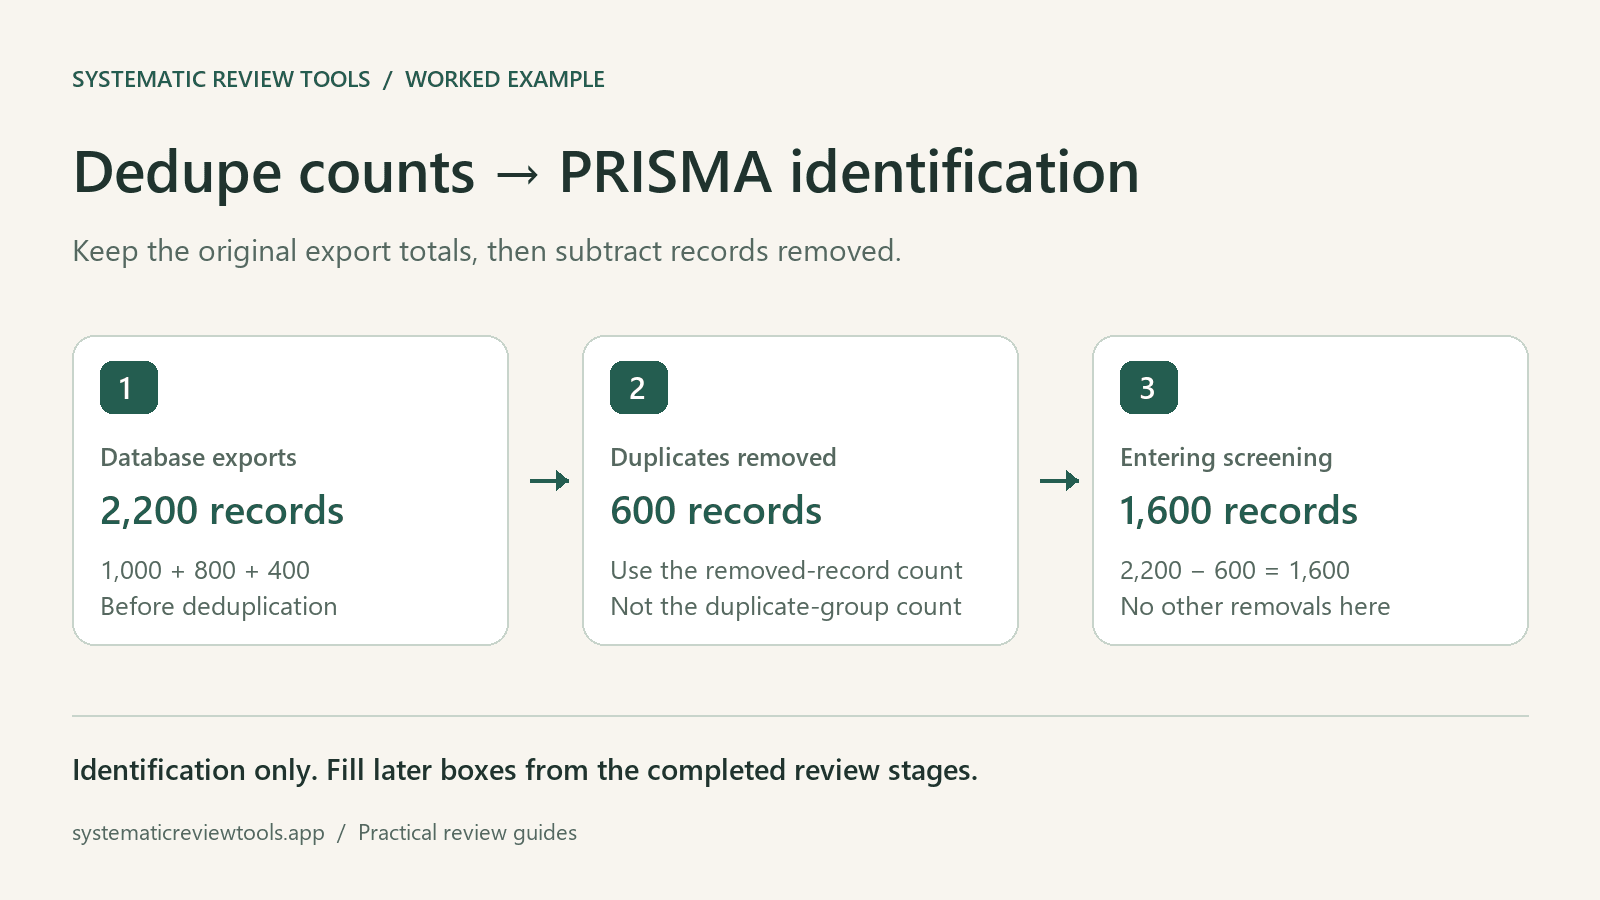
To start a PRISMA flowchart after deduplication, keep the original database export counts and the number of duplicate records removed. Enter the original total under Databases and the removed records under Duplicates removed in the PRISMA Flowchart Generator. With no other removals or register results, the difference is the number of records entering screening. Here is a worked example using 2,200 exported records, 600 duplicates removed, and 1,600 records to screen.
Keep the counts before you deduplicate
For this fictional review, the team searched three databases and exported these records:
| Source | Records exported before deduplication |
|---|---|
| PubMed | 1,000 |
| Embase | 800 |
| Web of Science | 400 |
| Total | 2,200 |
Save each original export alongside its database name, search date, and final query. These are counts from the searches, including records that also appear in another database. Do not replace them with the number of records left after deduplication.
Run the files together through the Deduplication tool. The example result is:
- Total records: 2,200.
- Duplicates removed: 600.
- Unique records retained: 1,600.
Download the RIS and audit reports before leaving the result page. Use the summary and audit to confirm what was removed. The multi-database deduplication guide covers preparing the exports and reviewing the matches.
Map the result into Identification
Open the flowchart tool from the public page and sign in to use the dashboard. This example is a new review with database searches only: no previous-review studies, register results, or other-source searches.
In Identification, enter:
| Field in the generator | Example value | Where it comes from |
|---|---|---|
| Databases | 2,200 | Sum of the three original exports |
| Registers | 0 | No register searches in this example |
| Duplicates removed | 600 | Removed records in the deduplication result |
| Automation tool excluded | 0 | No separate automated eligibility exclusions |
| Other exclusions | 0 | No other records removed before screening |
The generator calculates Records screened as 1,600:
2,200 database records + 0 register records
- 600 duplicates - 0 automation exclusions - 0 other exclusions
= 1,600 records entering screening
If you enable individual database counts, use the format shown in the tool:
PubMed, 1000; Embase, 800; Web of Science, 400
Those numbers must add up to the Databases total. The 1,600 retained records are a cross-database result, not a replacement for that total.
Count removed records, not duplicate groups
A duplicate group can contain more than two records. If one article appears in three exports and you keep one record, you have removed two duplicate records from one group. For the flowchart, use the deduplication result's Duplicates removed count, not Duplicate groups.
Deduplication also differs from excluding a record on eligibility grounds. Keep duplicate removals in their own field; do not enter the same 600 under Automation tool excluded or Other exclusions as well.
Check the handoff before filling later stages
For this example, the screening corpus should contain 1,600 records. If its actual size differs, reconcile the discrepancy against the audit and any additional removals before using the counts in the figure.
If you actually removed another 20 records before screening, record that reason and count separately. The screening total would then be 1,580, not 1,600. Never use Other exclusions as an unexplained adjustment to make the figure balance.
Deduplication supplies identification counts. It does not supply title/abstract exclusions, reports not retrieved, full-text exclusion reasons, or the final number of included studies. Fill those from the corresponding review stages when they are complete. Multiple reports can describe one study, so a unique bibliography record is not automatically a unique included study.
The official PRISMA flow-diagram page provides templates for different review and source combinations. Use the one that matches your review. When the counts are complete, the SRT generator offers PDF, PNG, and SVG output. Pair the figure with the PRISMA reporting guide and keep the source exports and audit with your review records.

About the Author
Connect on LinkedInGeorge Burchell
George Burchell is a specialist in systematic literature reviews and scientific evidence synthesis with significant expertise in integrating advanced AI technologies and automation tools into the research process. With over four years of consulting and practical experience, he has developed and led multiple projects focused on accelerating and refining the workflow for systematic reviews within medical and scientific research.